A lost 1981 Iowa Poll #248 asked Iowans if the number of children they have would change if they had to do it all over again. After restoring the data from this survey, IPOL found that 7 in 10 parent at the time said they would have the same number of children while about 2 in 10 would have more children. Interested in gaining a better understanding of how attitudes toward parenthood and family-size have changed over time, IPOL decided to place the same question on a recent survey. To that end, respondents in a 2026 U.S. national poll were asked if they were a parent and, if so, were then asked “If you had to do it over, would you have more, same, fewer, or no children?”
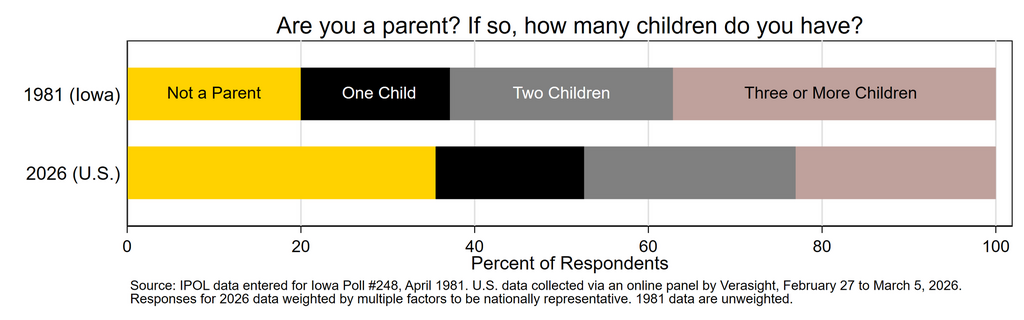
In 1981, 80% of respondents indicated they were parents. Of those parents, 70.0% said they would have the same number of children, 19.9% would have more children, 6.4% would have fewer children, and 2.2% would have no children. Parents with two children were the most likely to say they would have the same number of children, parents with only one child were the most likely to want more children, and parents with three or more children were the most likely of the groups to report wanting less children at 12.6%. Age also differentiated responses with more 18–29-year-olds and the 65+ age group reporting wanting more children, while more of the middle age groups reported wanting the same or fewer children.
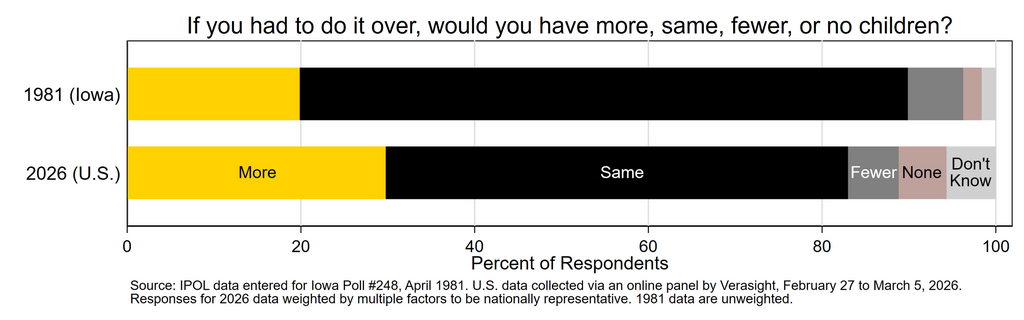
Comparatively, in 2026, fewer respondents were parents at 64.5%. Of those parents, 52.6% would have the same number of children, 29.8% would have more children, 6.1% would have fewer children, and 6.0% would have no children. These respondents show a seventeen percentage point decrease in wanting the same number of children, largely offset by a ten percentage point increase for wanting more and a four percentage point increase in no children compared to 1981. This pattern partly reflects substantial differences in the number of children respondents had in the two surveys, most notably an increase from 20.0% to 36.3% of those that had no children and similar decline among those that had three of more children from 37.2% to 22.9%.
Comparing preferences across the number of children that they currently have as parents shows that those with two children were the most likely to say they would have the same number of children, parents with only one child were the most likely to want more children, and parents with three or more children were the most likely of the groups to report wanting fewer children. However, there are interesting increases with 10.5% of respondents with one child in 2026 reporting that they would have no children compared to 4.1% in 1986 and 21.2% of respondents with three or more children in 2026 reporting wanting more children compared to 8.1% in 1981. The age trend somewhat reversed in 2026 with the 18-29-year-olds and the 65+ age group reporting wanting more children at lower rates than the middle age groups. Instead, the youngest age group was more likely to report wanting fewer and no children while the oldest age group was more likely to report wanting the same number of children.
Iowa Poll #248, conducted by the Des Moines Register, was administered to a random sample of Iowans in April 1981 and includes 1011 responses. We re-ran these questions by placing them on a national survey of U.S. adults fielded from February 27 to March 5, 2026 that yielded 1000 responses. Responses for 2026 data are weighted by age, race/ethnicity, sex, income, education, region, metropolitan status, and partisanship to be nationally representative. Support for 2026 data collection was provided by the Center for Social Science Innovation at the University of Iowa through its Survey Harvest program.